Step 1: Open your daily downloads
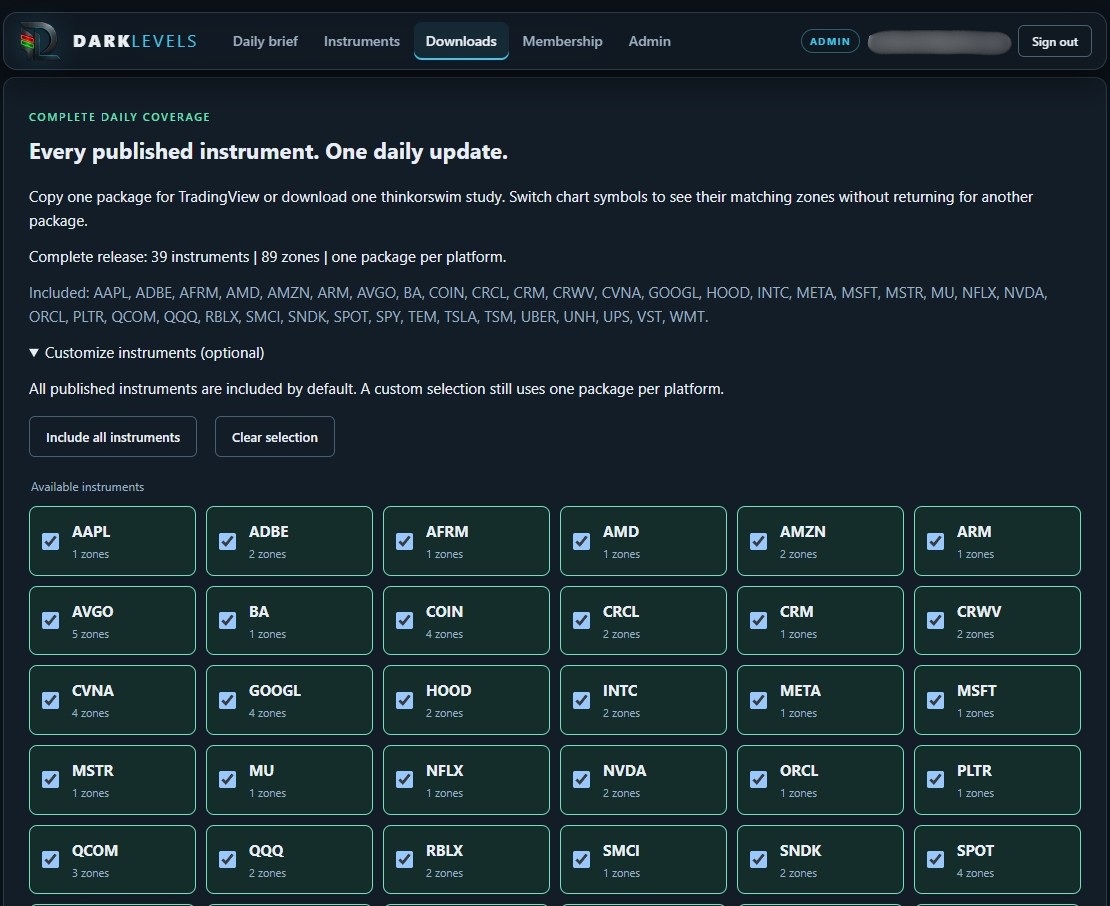
Sign in to Downloads with Premium or Elite access. Check the latest release, its validity dates and included instruments. All published instruments are included by default.
 DARKLEVELS
Install the indicator once. Load the complete daily release. Switch between covered symbols with the same package.
For TradingView on a laptop or desktop. The examples show Windows shortcuts; on macOS, use Command in place of Ctrl. Screenshots show an example release and administrator account; your date, coverage and navigation may differ. Click any screenshot to open it full size.
You keep the installed script. Each new release updates its data field. Updates and corrections are not fetched automatically.
Downloads requires an active Premium or Elite membership. Existing users on an earlier renderer need one source upgrade to v4 before loading a complete watchlist.
Sign in to Downloads with Premium or Elite access. Check the latest release, its validity dates and included instruments. All published instruments are included by default.
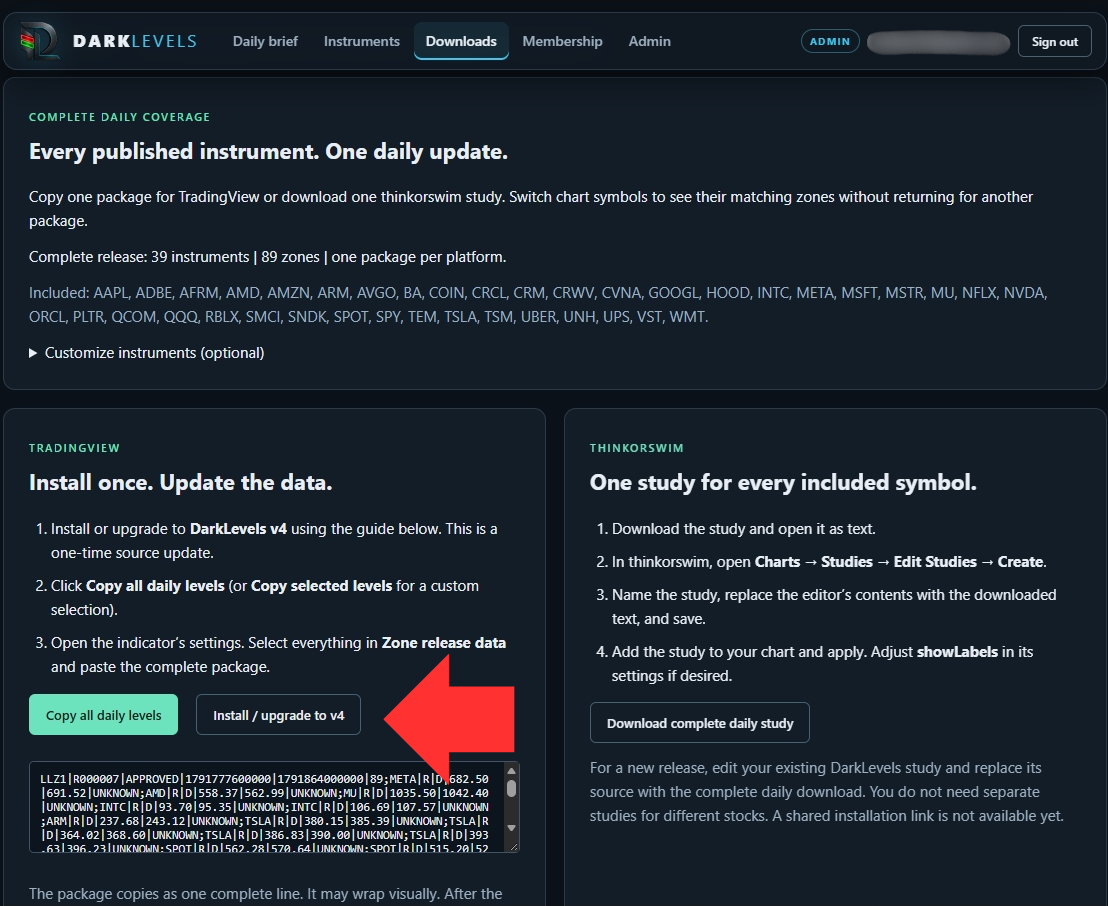
Click Install / upgrade to v4 in the TradingView panel. In the dialog, click Copy indicator source. Keep Downloads open in another tab.
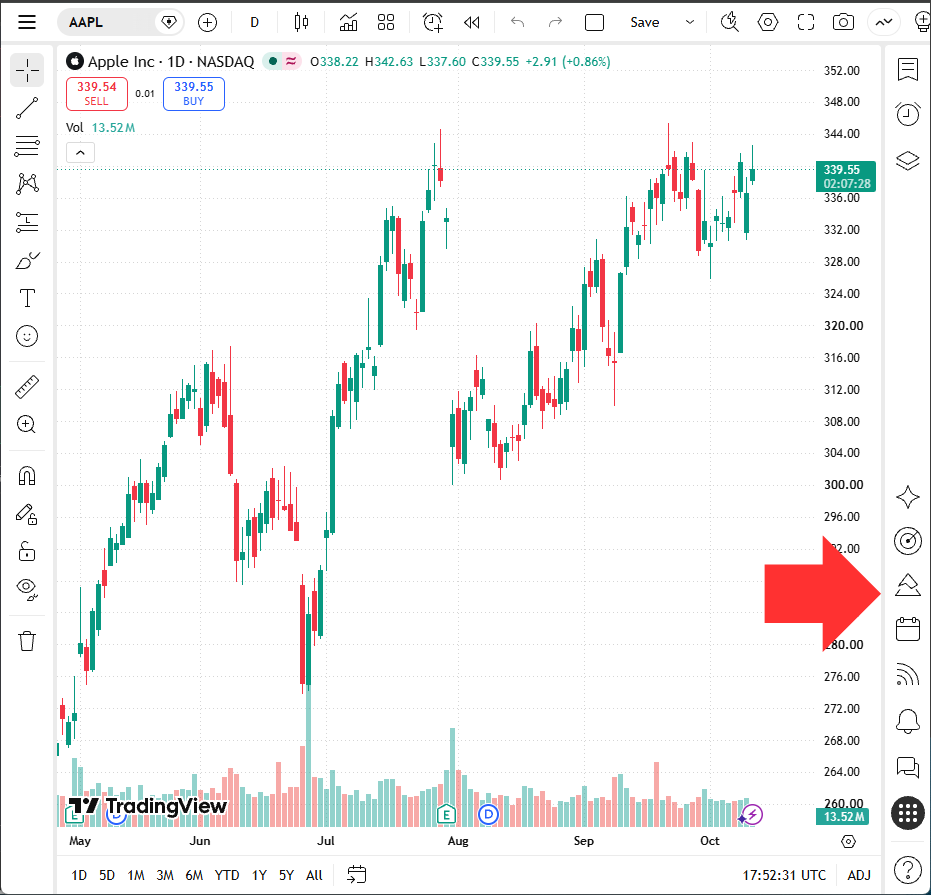
Open your TradingView chart and click the Pine Editor icon on the right toolbar, as shown. Editor placement may differ if you have rearranged your workspace.
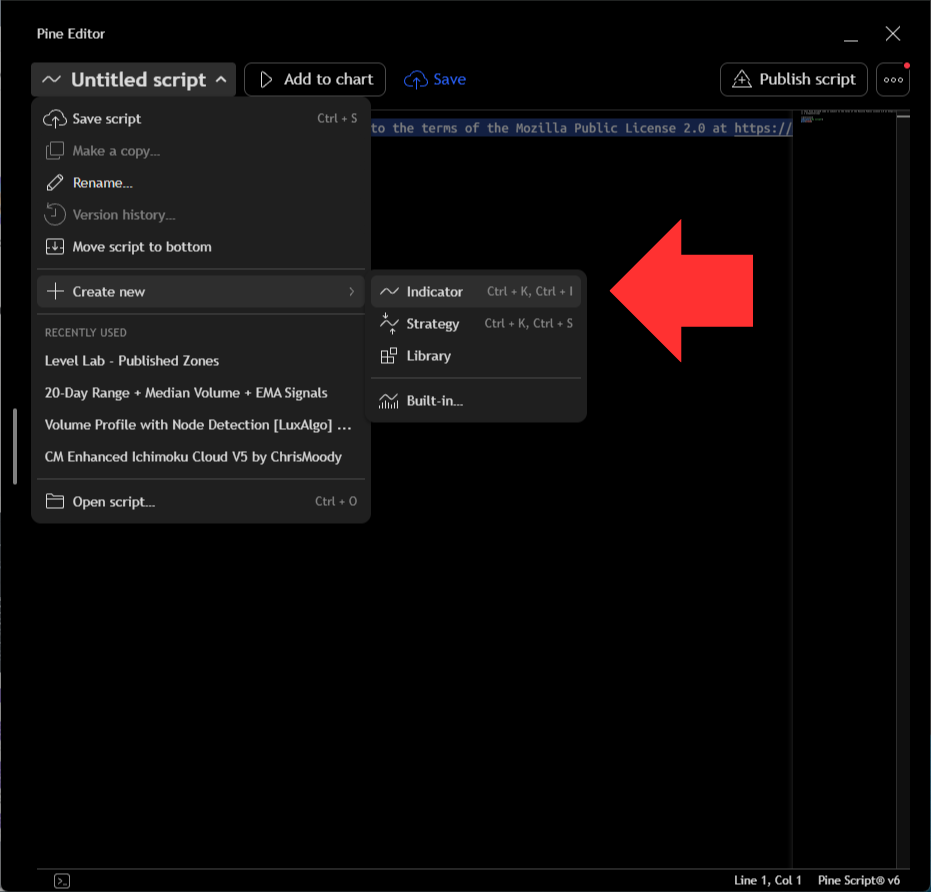
Open the menu beside the script name. Choose Create new → Indicator. If upgrading an existing DarkLevels indicator, open its saved source instead.
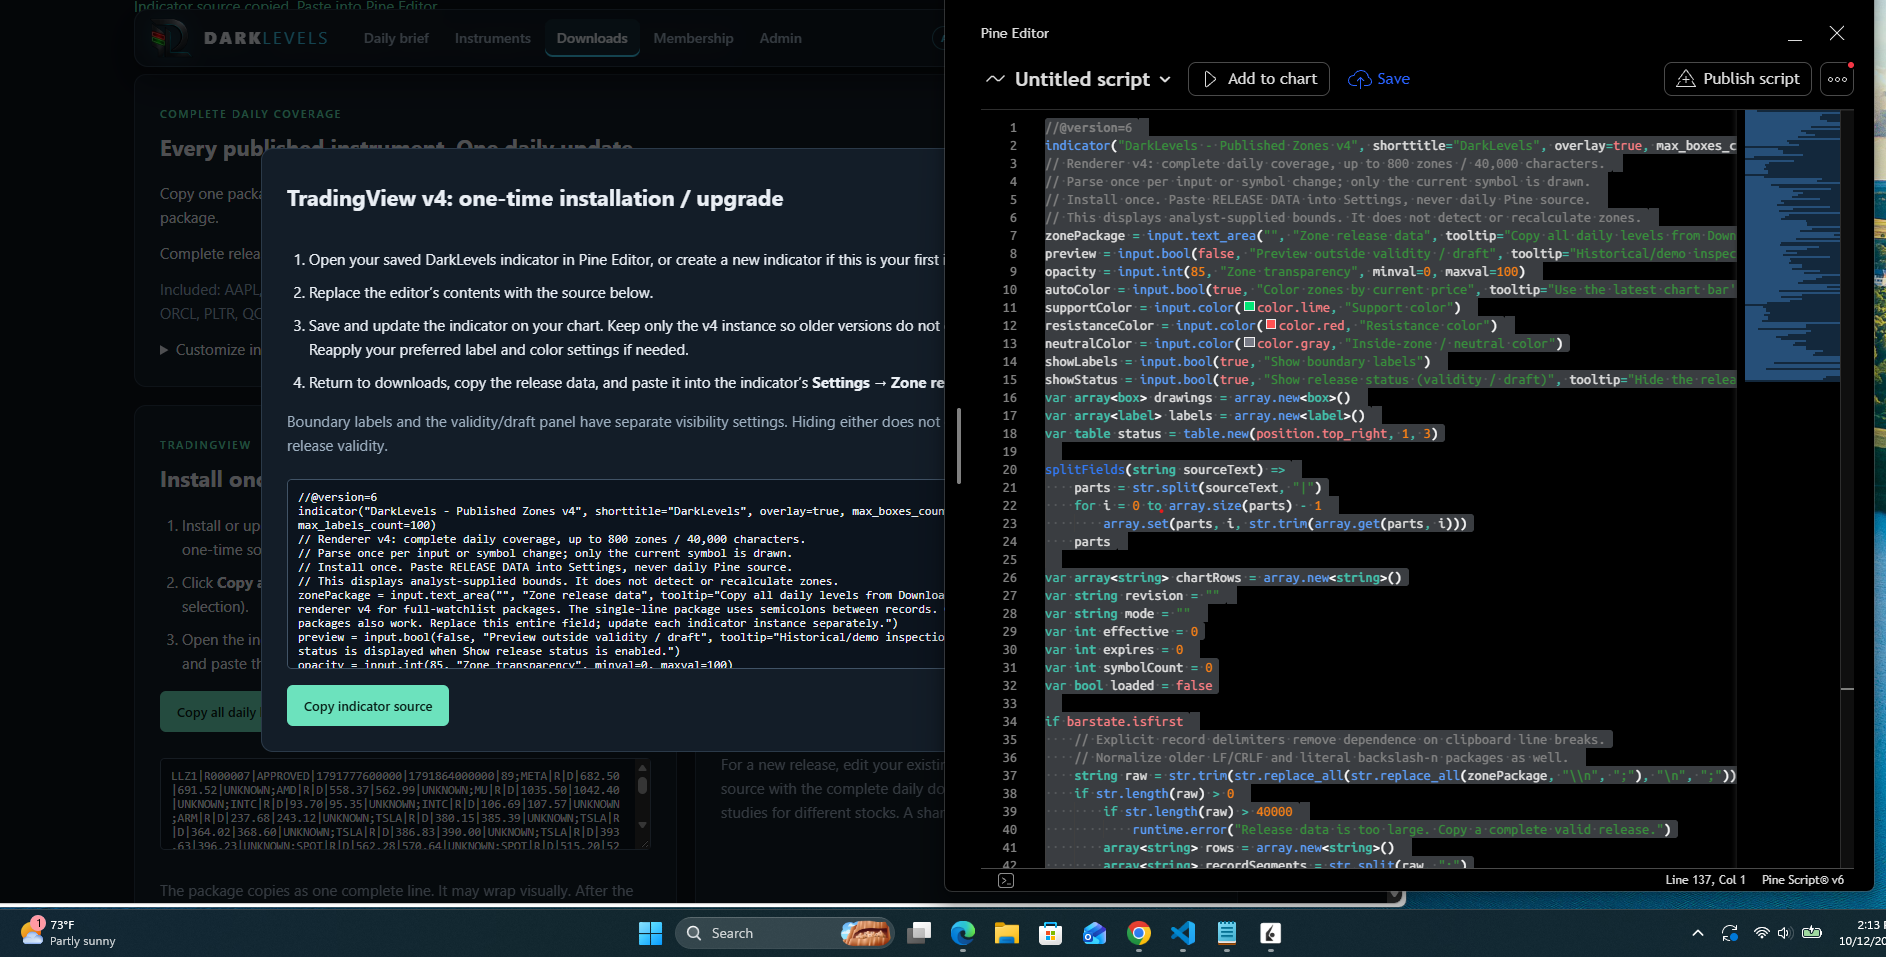
Click inside Pine Editor. Press Ctrl + A, then Ctrl + V to replace the starter code. Click Save and name it DarkLevels Daily Zones. Click Add to chart, or update the existing chart instance. Keep one v4 instance on the chart.
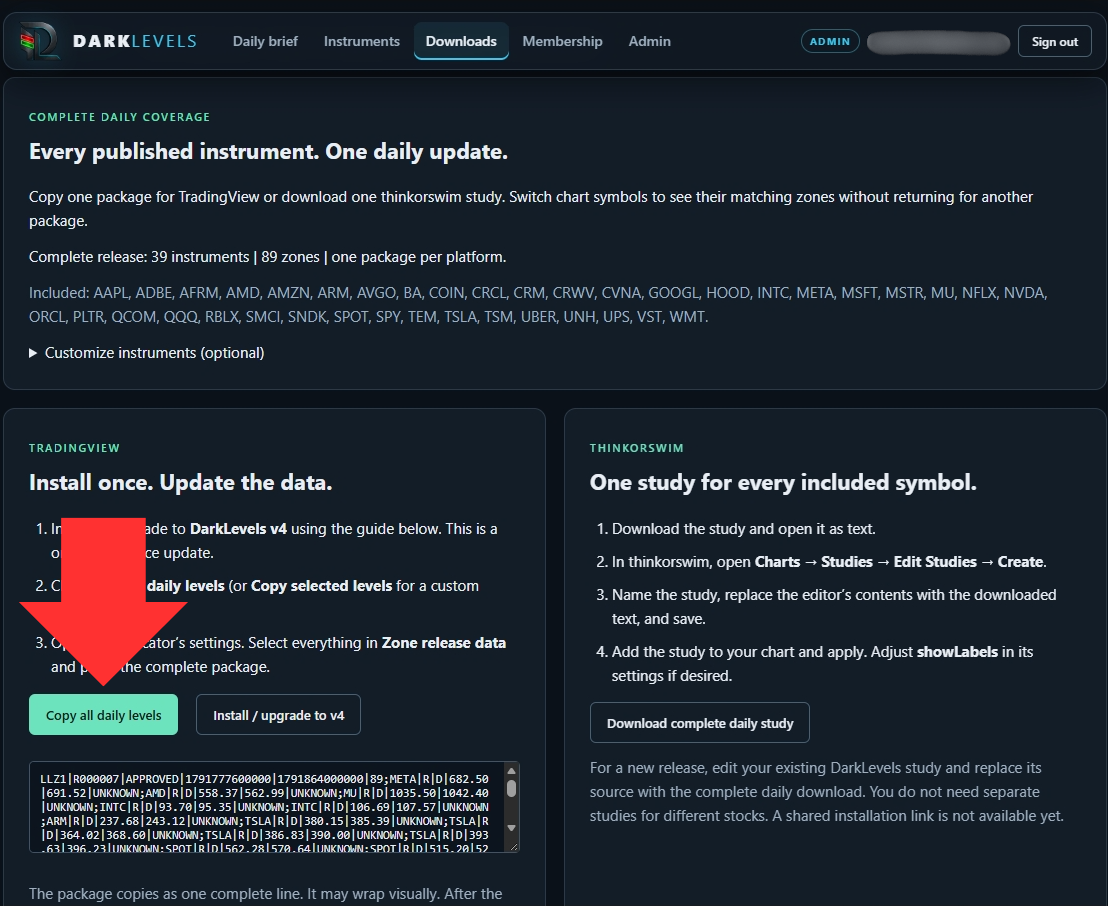
Return to Downloads, close the source dialog and click Copy all daily levels. The copy confirmation reports the instruments and zone count. This package contains the prices for the selected release.
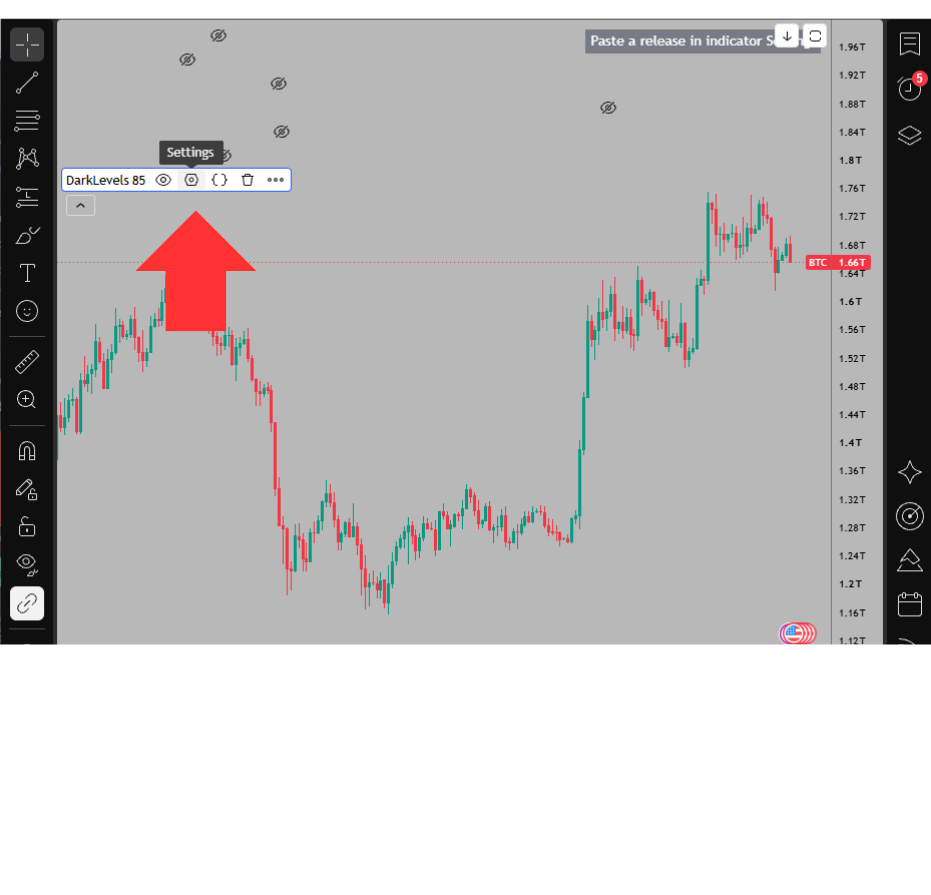
Return to TradingView. Hover over DarkLevels in the chart legend and click its settings gear. Expand the indicator legend first if it is collapsed.
Under Inputs, click inside Zone release data. Press Ctrl + A, then Ctrl + V. Leave Preview outside validity / draft unchecked for normal use. Click OK.
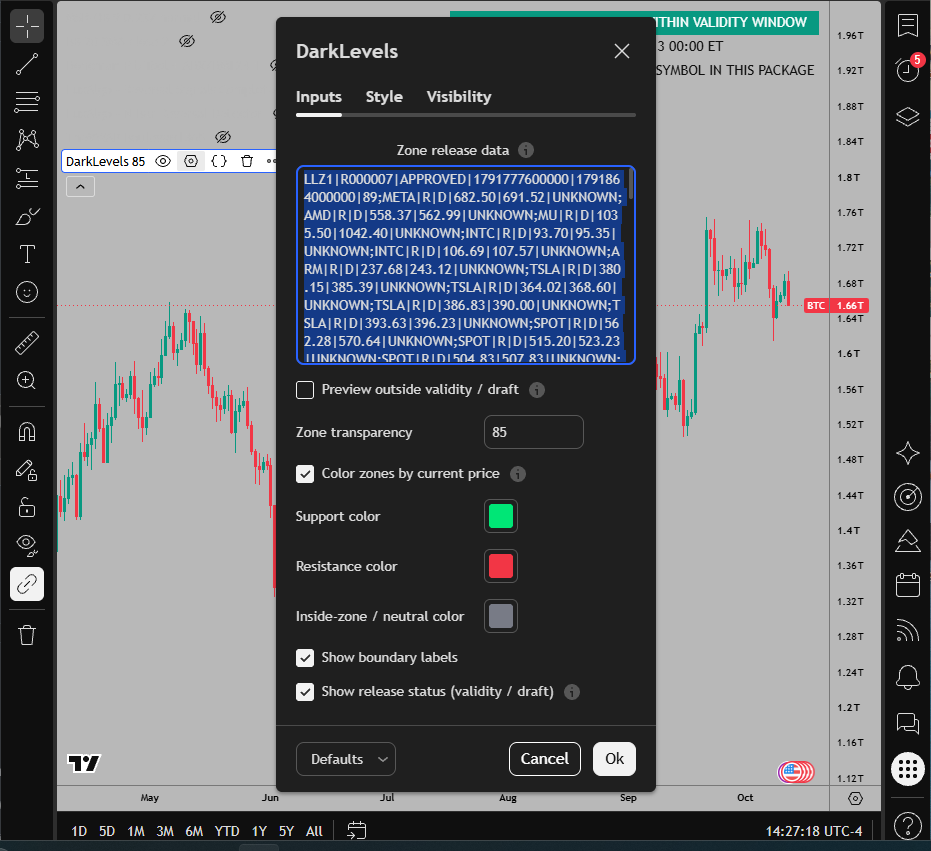
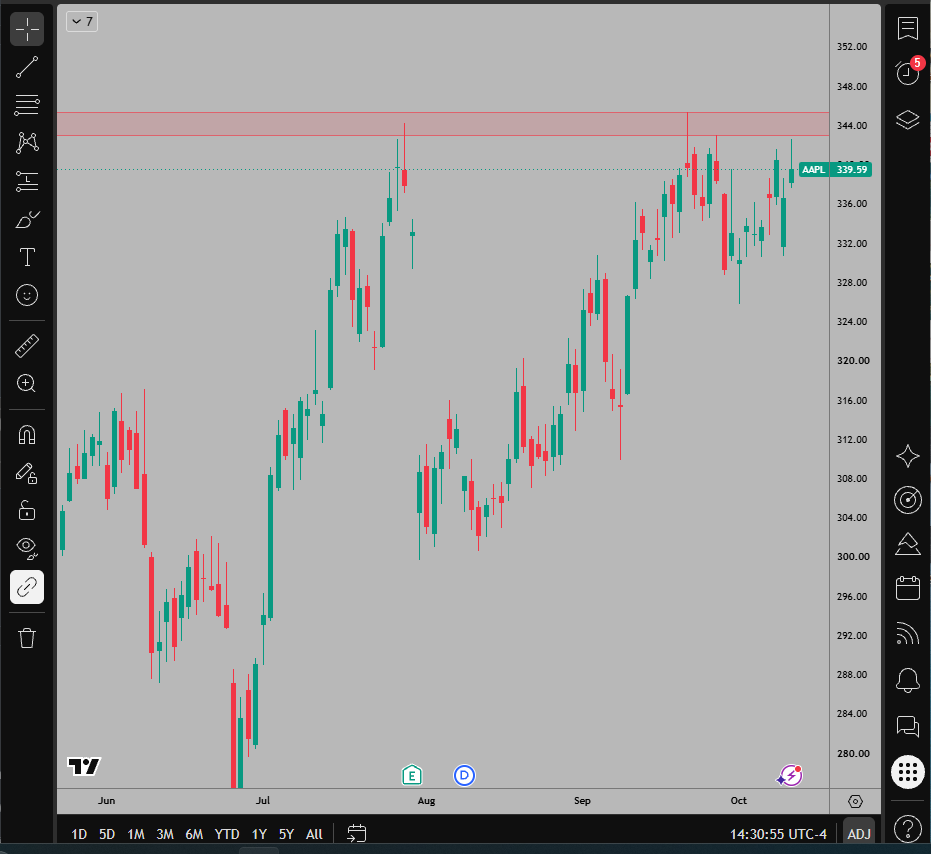
Select an instrument listed in the release. Its zones should appear across the chart. With Color zones by current price enabled, zones above price are red, zones below price are green and zones containing price are neutral.
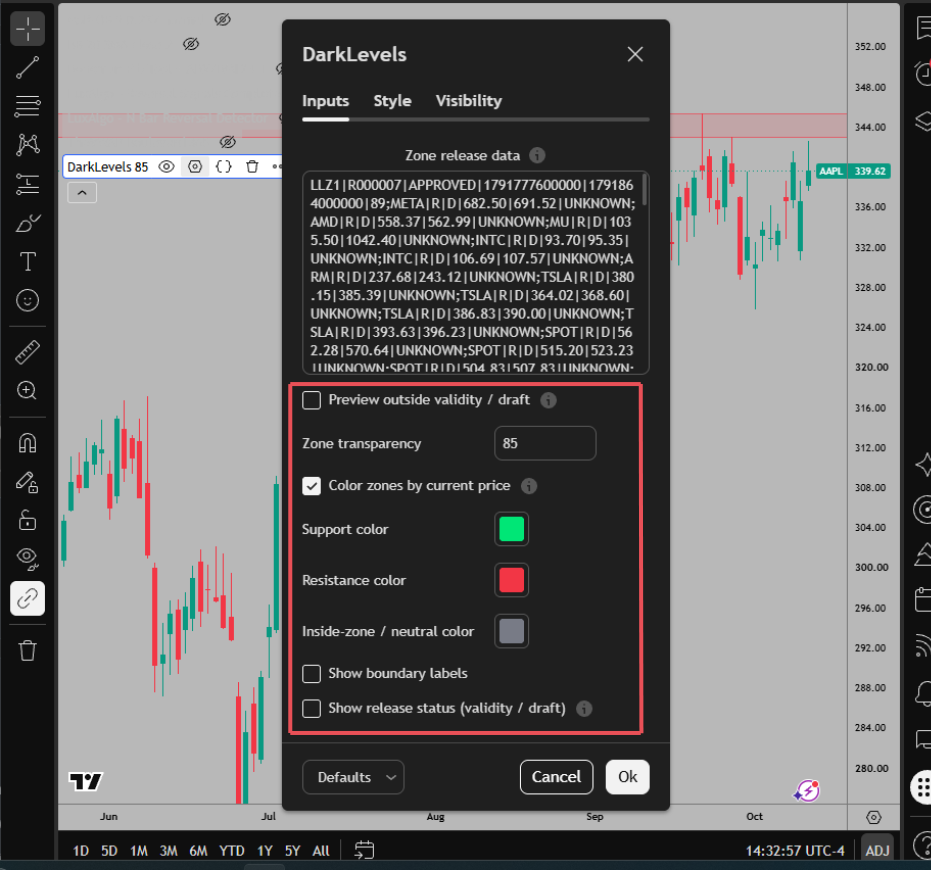
Open Inputs again to adjust Zone transparency and colors. Show boundary labels controls the price labels. Show release status (validity / draft) controls the status panel. Hiding either leaves zones and validity checks in place.
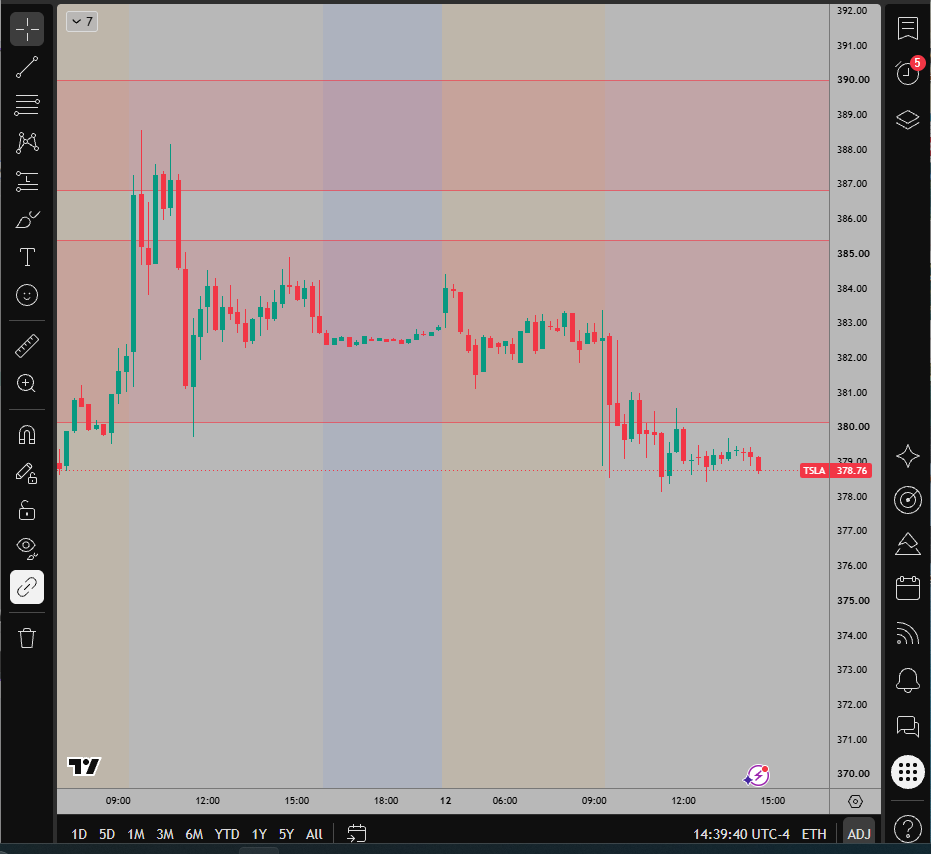
Change to another instrument included in the release. The same indicator and pasted package display its matching zones. You do not need another symbol package.
Check the latest published release on Downloads and paste its complete data. Leave preview off for normal use. Preview is for historical or draft inspection; it does not make an old release current.
Choose a symbol listed under Included on Downloads. If you used a custom selection, choose Include all instruments and copy again. Check the exact symbol and, for futures, the contract and price basis.
Confirm you installed v4 using the source dialog. Copy all daily levels again and replace the entire Zone release data field. Release data belongs in Inputs; indicator source belongs in Pine Editor.
Keep one DarkLevels instance on the chart. Adjust Zone transparency and Show boundary labels in Inputs. Show release status can be hidden separately without changing zone validity.
Each separately configured indicator instance needs its data updated. Changing the symbol within an updated instance uses that same package.
Still need help? Email support@darklevels.com with your chart symbol, release ID and any exact error message.
Follow the thinkorswim screenshot guide for installation, daily source updates and display settings.