These screenshots use thinkorswim desktop on Windows. Dates, prices and coverage are examples; your account navigation may differ. Click any screenshot to open it full size.
In Edit Studies, right-click DarkLevels_Daily → Edit sources.... Replace the entire code, then click OK, Apply and OK.
Check the release and zones on your charts. Separate copies with different study names also need updating.
The daily download contains both the indicator code and that release's prices. Updates and corrections are not fetched automatically.
FIRST-TIME SETUP
Install your daily zone study
Use thinkorswim desktop and a plain-text editor. Downloads requires an active Premium or Elite membership.
01
Step 1: Download the complete daily study
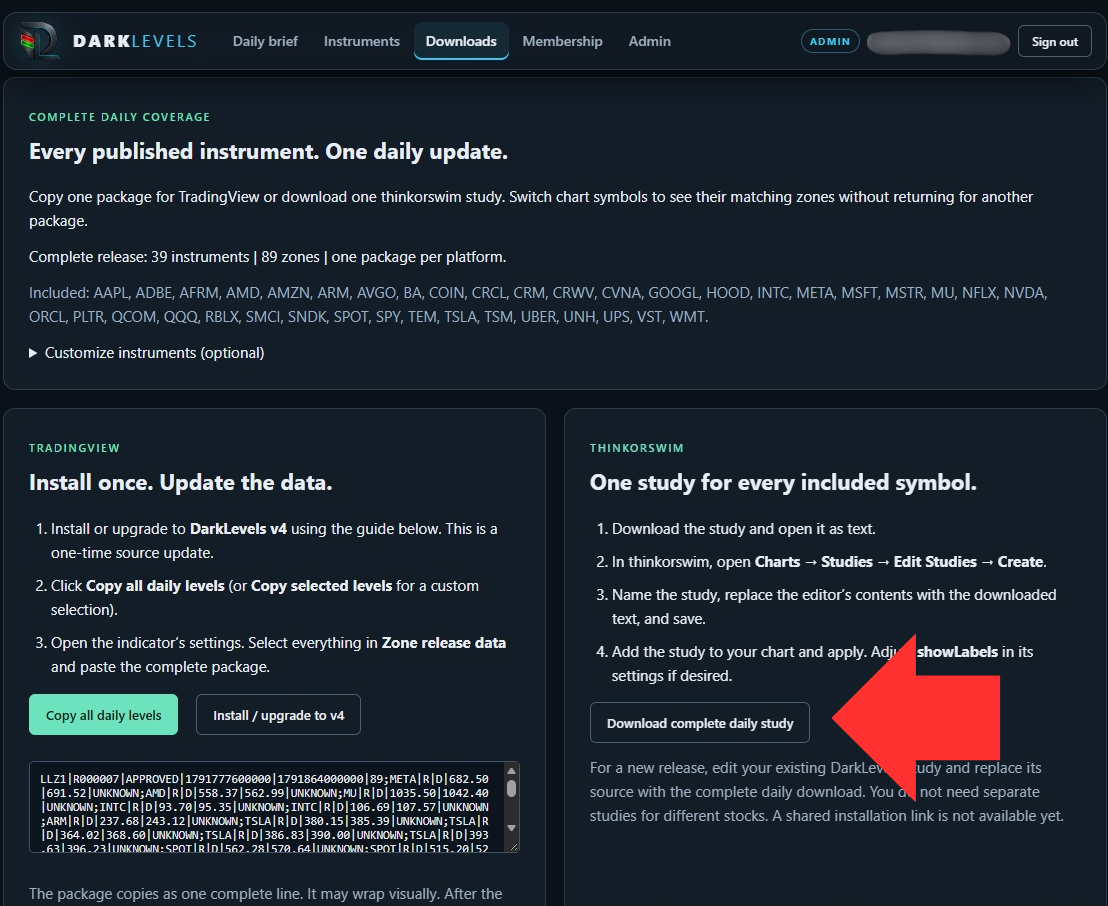
Sign in to Downloads with Premium or Elite access. Check the latest release, its validity dates and included symbols. Leave all instruments included and click Download complete daily study in the thinkorswim panel.
One download covers every included instrument. The release date, count and navigation shown here are examples. Open full size
02
Step 2: Open the file and copy its contents
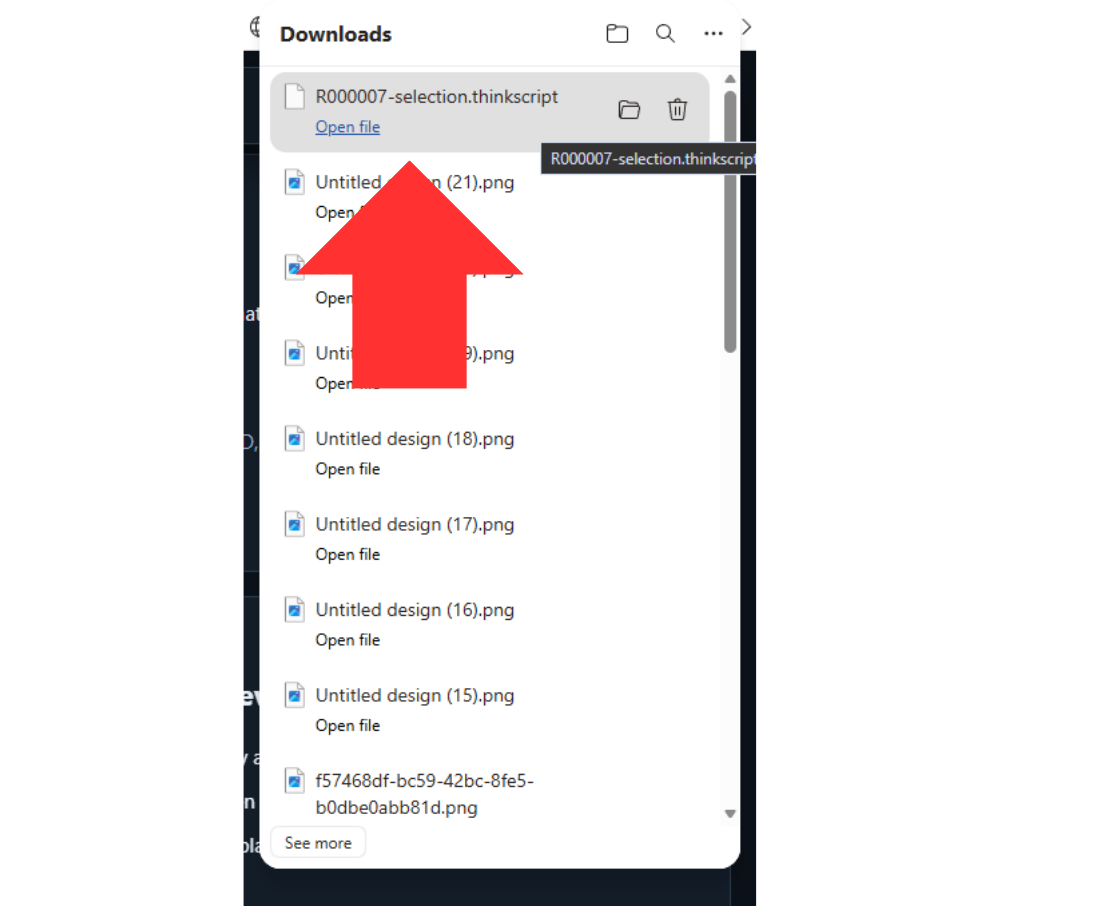
Open the downloaded .thinkscript file using a plain-text editor such as Notepad. If Windows asks which app to use, choose Notepad; you can also right-click the file in your Downloads folder and choose Open with → Notepad. Inside the text, press Ctrl + A, then Ctrl + C to copy the entire study.
The screenshot locates the file in browser Downloads. Open it as text, then copy everything inside; the filename alone is not the study code. Open full size
03
Step 3: Open Edit Studies
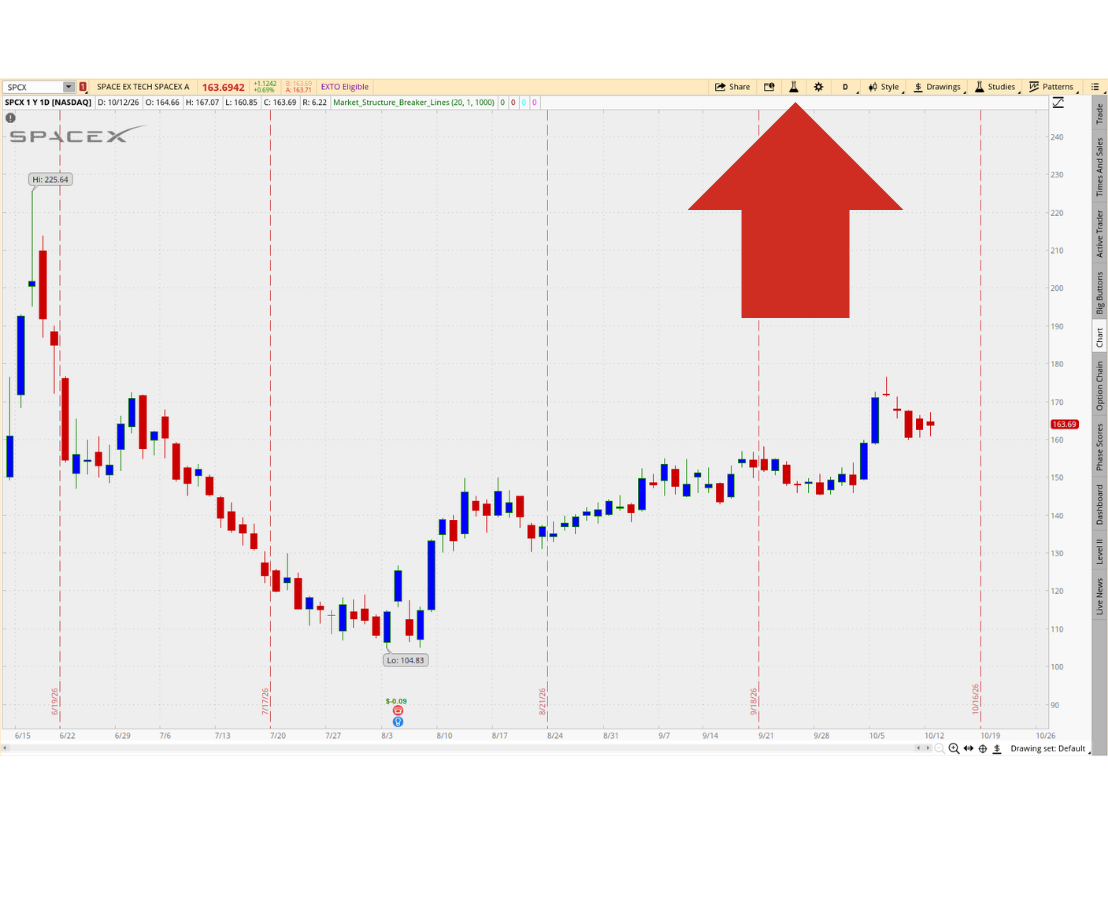
In thinkorswim desktop, open a chart. Click the flask-shaped Edit Studies shortcut highlighted here, or choose Studies → Edit Studies from the chart toolbar.
These setup screenshots use an SPCX background chart. That symbol is not in the example release; switch to an included instrument after installation. Open full size
04
Step 4: Create your DarkLevels study
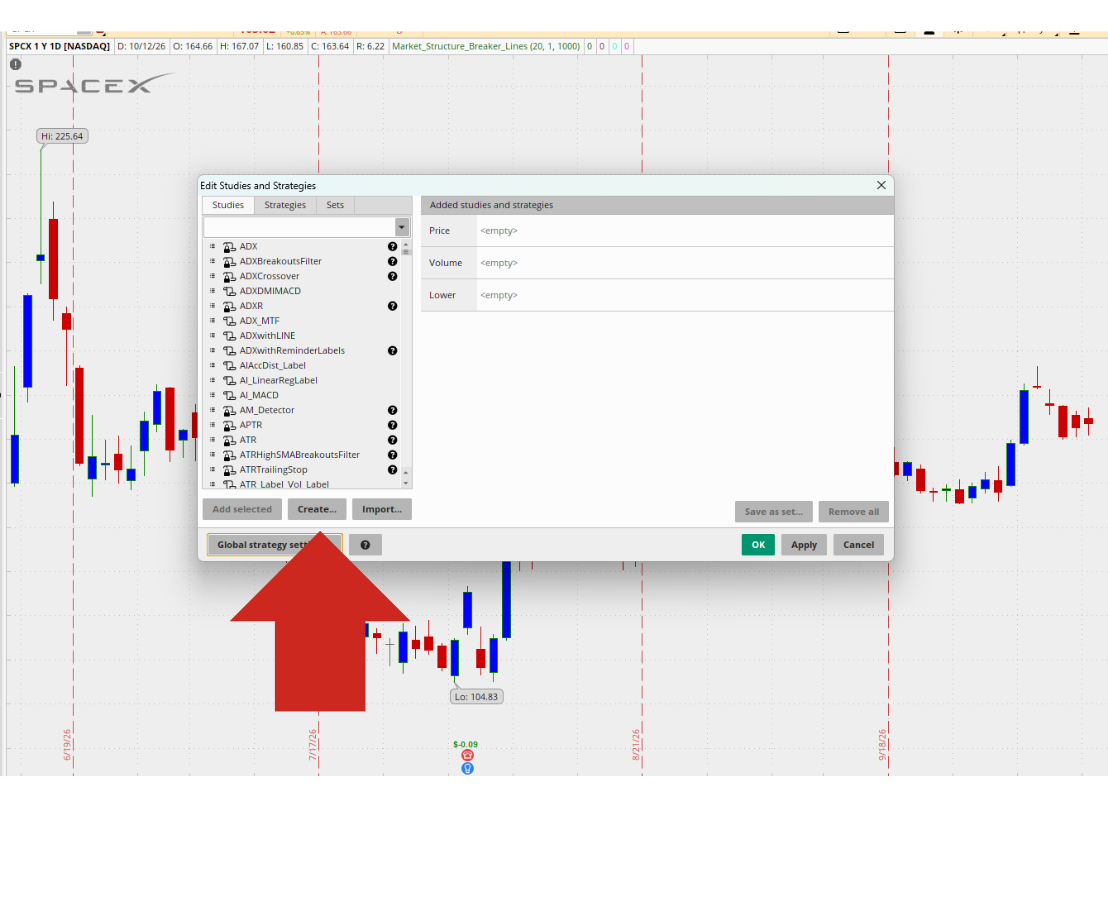
In Edit Studies and Strategies, stay on the Studies tab and click Create.... You only need this step for your first installation. For daily updates, use Edit sources on the study you already saved.
Use Create for this plain-text .thinkscript download. The Import button expects a different file format. Open full size
05
Step 5: Name the study and paste the code
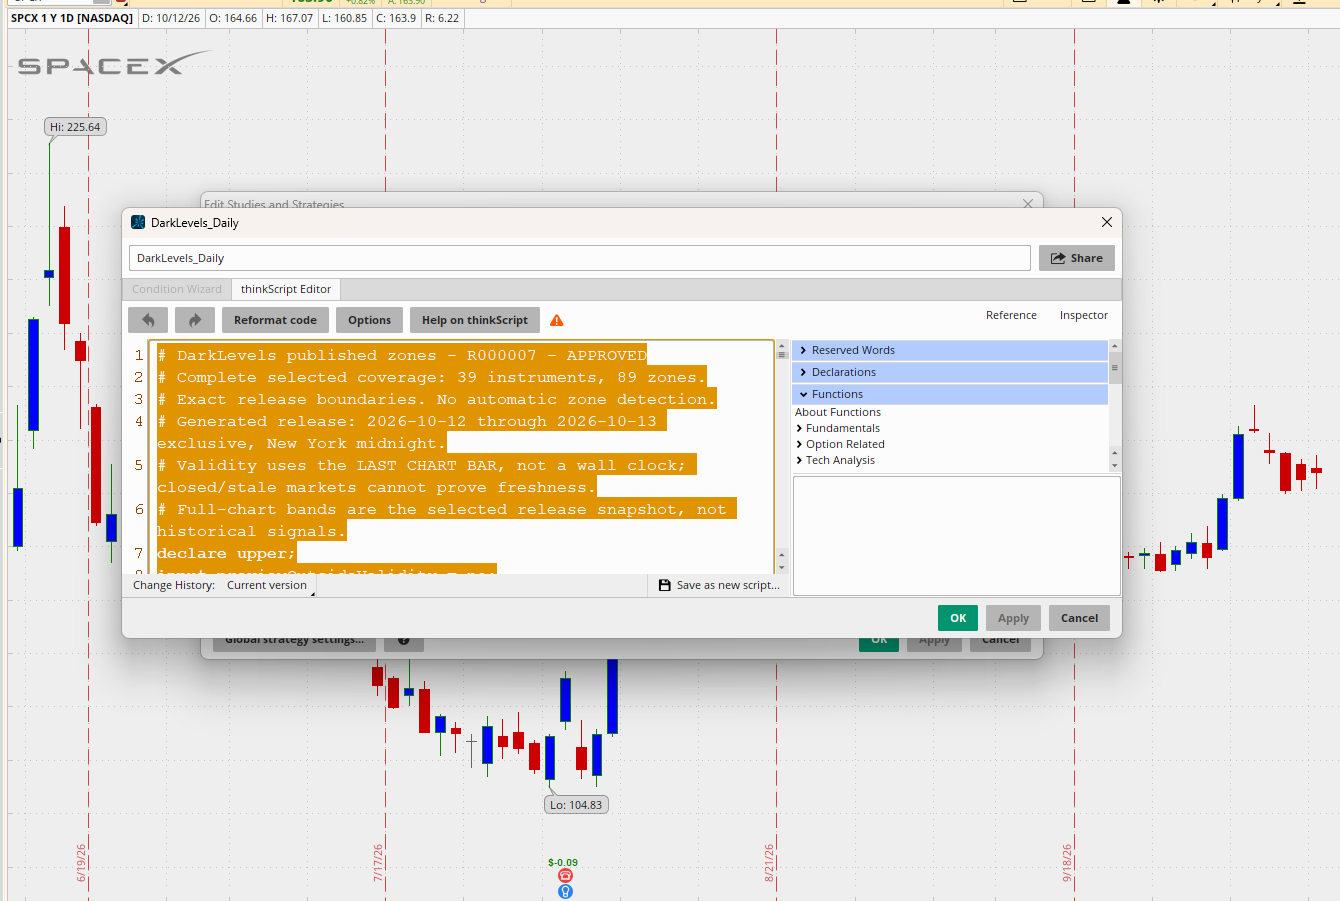
Name the study DarkLevels_Daily. Select the thinkScript Editor tab. Click inside the code area, press Ctrl + A, then Ctrl + V to replace all starter code with the complete downloaded study.
The header identifies the release and included coverage. You do not need to edit individual symbols, prices or code. Open full size
06
Step 6: Save and apply it to the chart
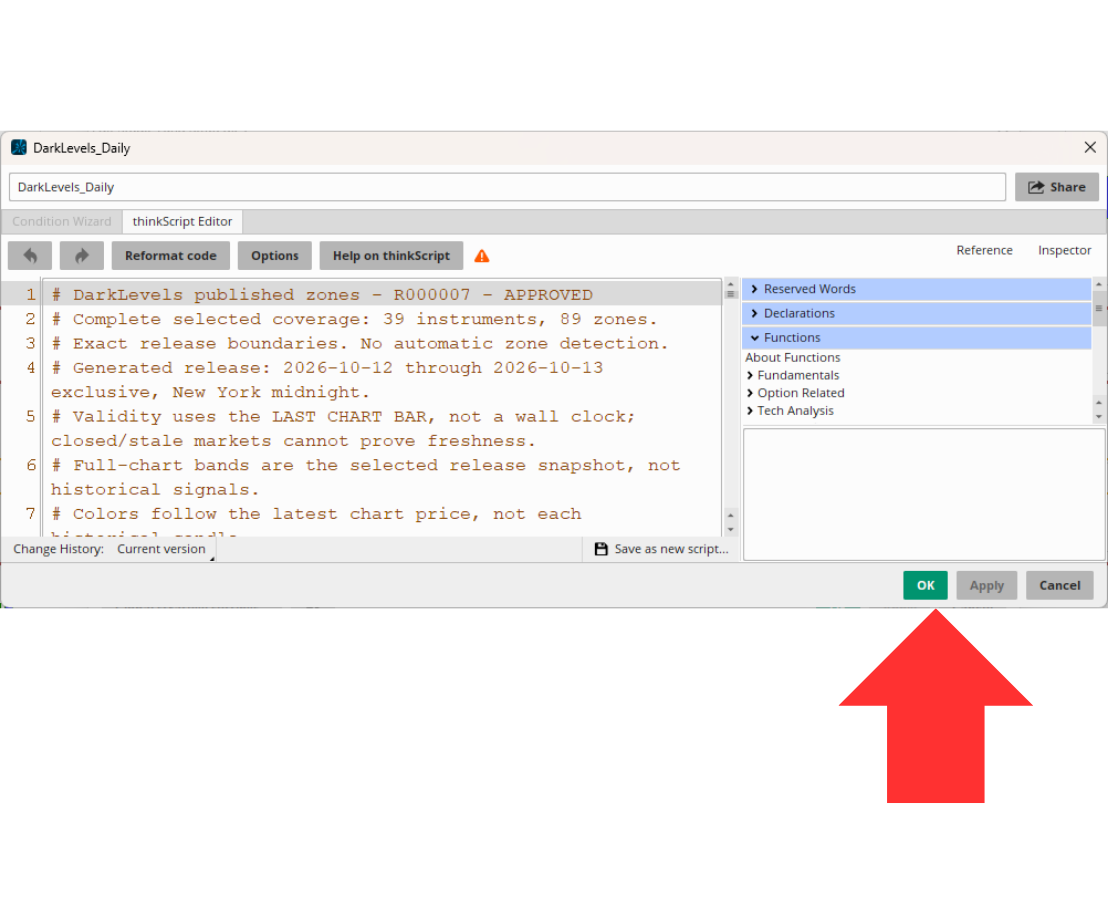
Click OK in thinkScript Editor. Back in Edit Studies, confirm DarkLevels_Daily appears under Price in the added studies list. If it is not there, search for the saved name in the left list, select it and click Add selected. Click Apply, then OK.
This screenshot shows saving the code. Finish by applying the study in the parent Edit Studies window. Keep one DarkLevels instance on each chart. Open full size
07
Step 7: Check the zones on a covered symbol
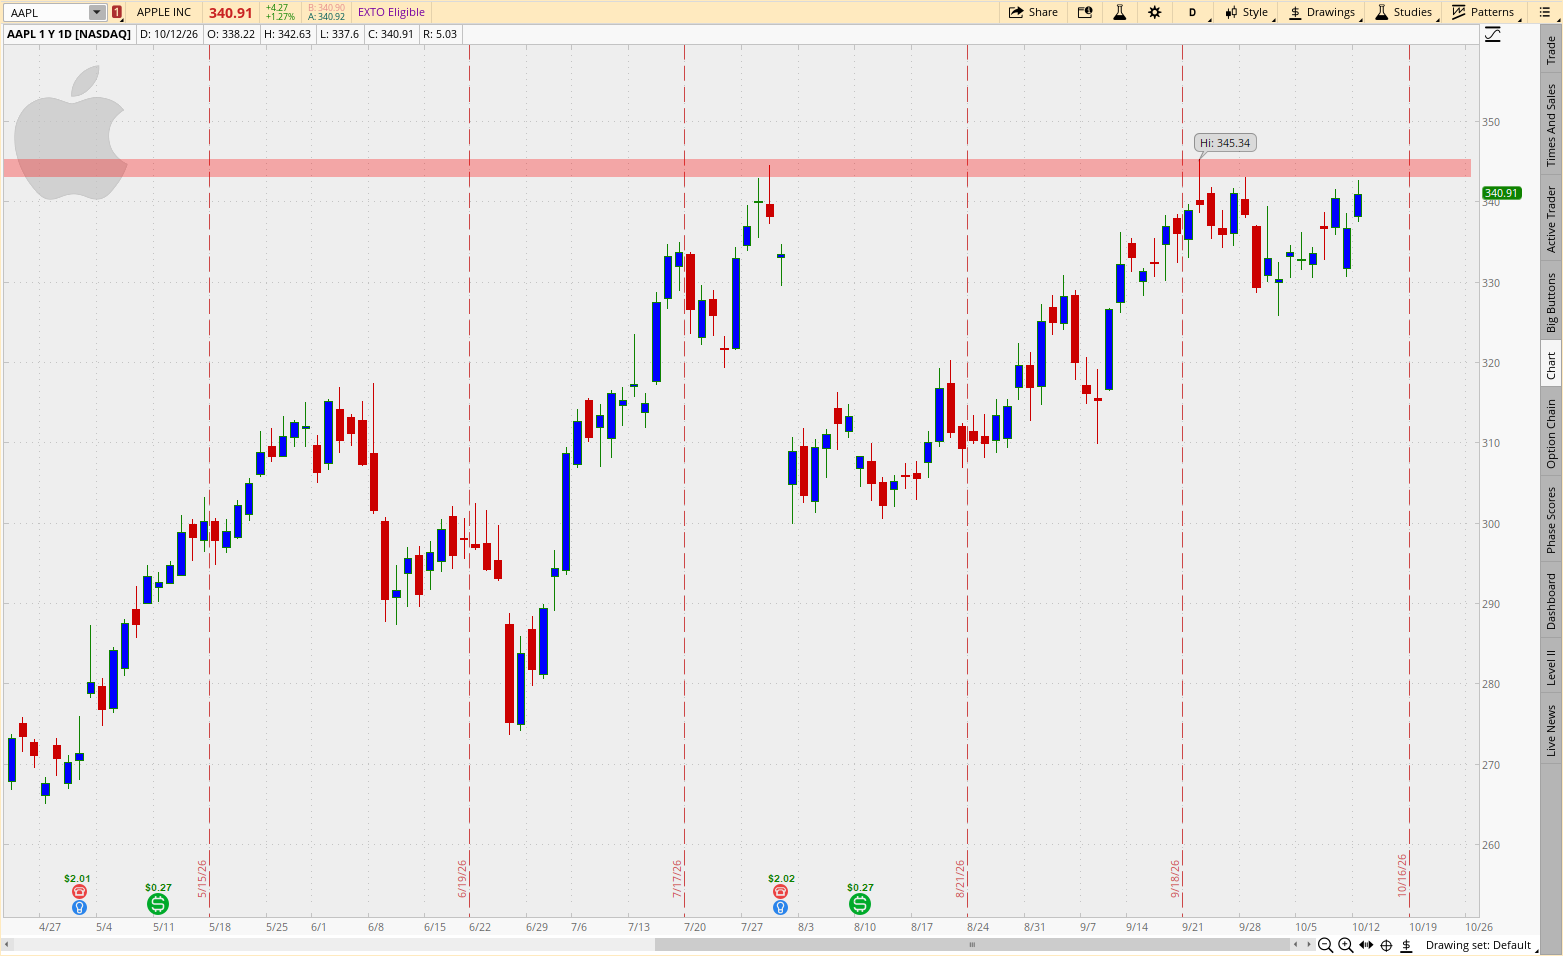
Select a symbol included in your downloaded release. The zones extend across the chart. With automatic coloring enabled, a zone entirely above the latest chart price is red resistance, a zone entirely below is green support, and a zone containing price is gray neutral. Change to another included symbol to see its zones with the same study.
Example: AAPL showing a red zone above price. The full band uses the latest chart price; its color is not a historical trade signal. Open full size
08
Step 8: Choose colors and label visibility
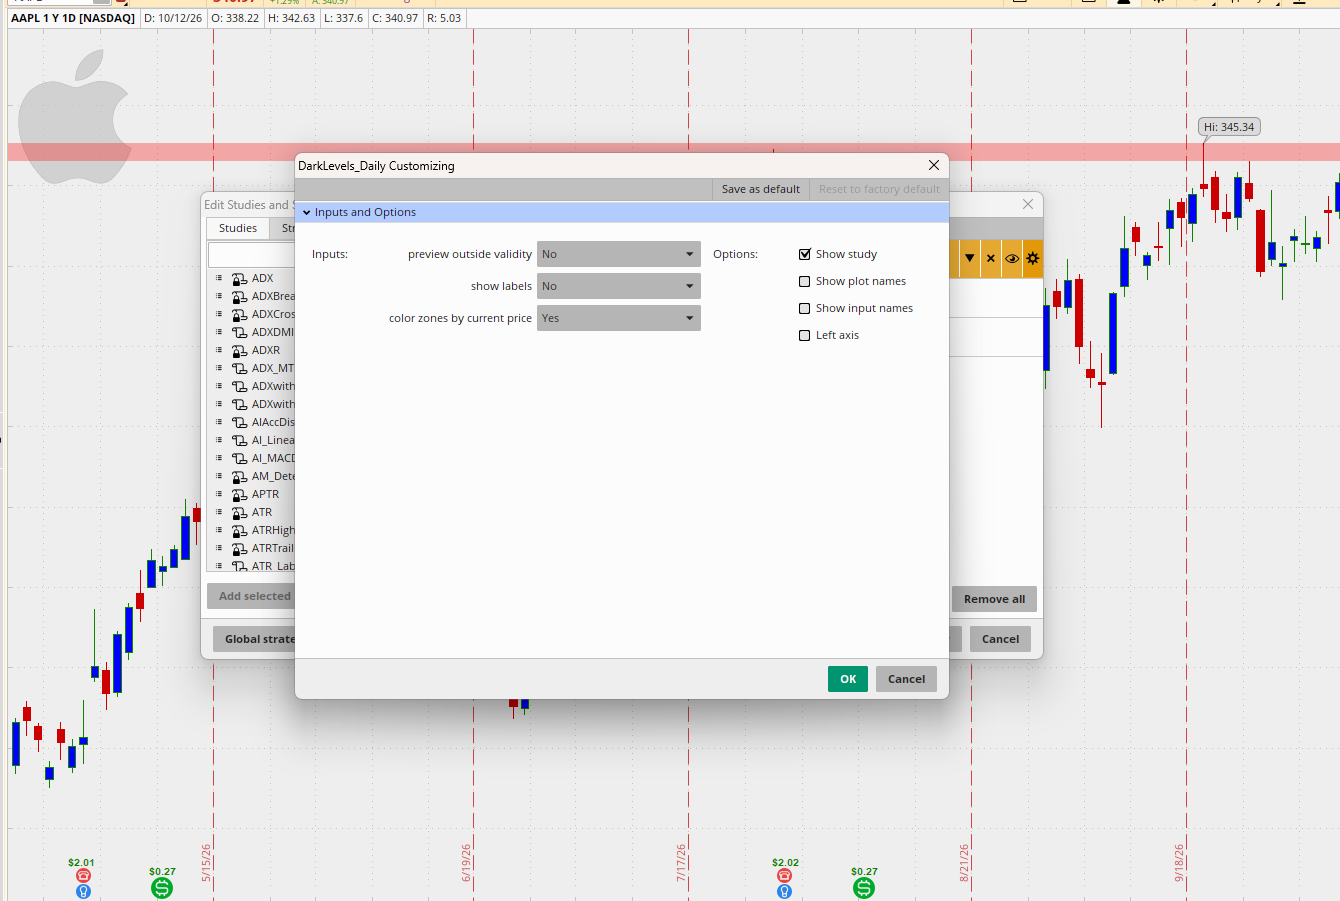
Open Edit Studies and click the gear beside DarkLevels_Daily. Leave color zones by current price = Yes for automatic red/green/gray coloring. Set show labels = No to hide release and zone labels. Keep Show study checked so the zones stay visible. Leave preview outside validity = No for normal use. Click OK, then apply your changes.
Turning automatic coloring off restores the saved zone types. Hiding labels leaves the zones and validity checks active. Open full size
09
Step 9: Replace the source for the next release
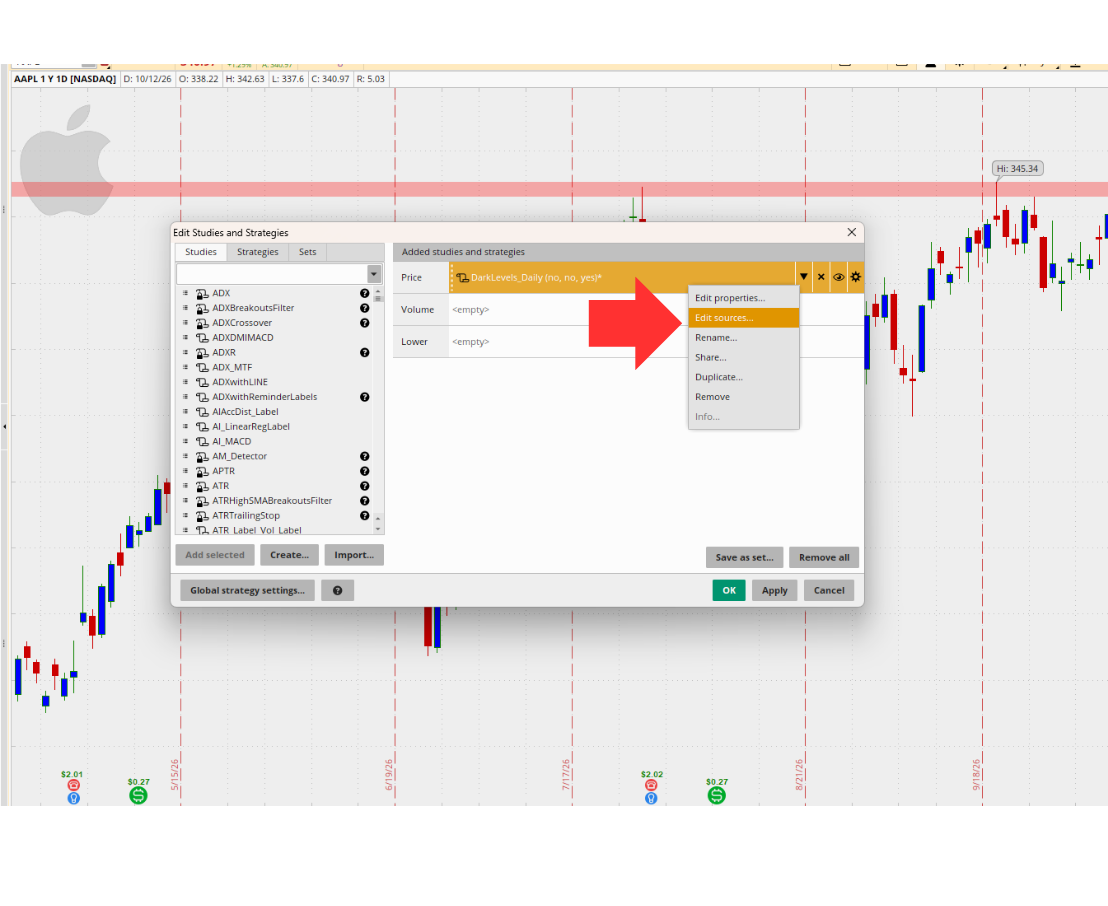
Download the newest complete study and copy all its text, as in steps 1–2. Open Edit Studies, right-click your existing DarkLevels_Daily entry and choose Edit sources.... In the code area, select everything and paste the new study. Click OK, then Apply and OK. Check your display settings and the new release on your charts.
Use Edit sources for daily updates; the settings gear changes display options. Keep the same study name instead of creating a new daily copy. Open full sizeQUICK FIXES
If something does not look right
The download will not open or import
Open the .thinkscript file with Notepad and copy its complete contents into thinkScript Editor. Do not use Word or paste the filename. The Downloads file is plain source text; the Import button accepts .ts files.
No zones appear on my chart
Check that the chart symbol is included in the release, DarkLevels_Daily is added under Price, and Show study is checked. Zones may be outside the visible price range. For futures, verify the symbol, contract and price basis match. If you used a custom download, return to Downloads and include all instruments.
The release is expired or I see a validity message
Download the current release and replace the whole study source. Keep preview outside validity set to No for normal use. Validity is checked against the latest chart bar, so a stale feed or old chart cannot establish current freshness. Check the release dates on Downloads too.
Zones are cyan or all the same color
Use the latest downloaded source and set color zones by current price to Yes. Above-price zones are red, below-price zones are green, and zones containing price are gray. All zones can correctly have the same color if they are all on the same side of price.
I want the zones without labels
Set show labels to No in the study's gear settings. Keep Show study checked. Unchecking Show study hides the whole indicator, including its zones.
I see duplicate zones or an older release
Keep one DarkLevels study on the chart and update it through Edit sources. Check other charts and any separately named copies. Temporarily set show labels to Yes to inspect the release information, then hide them again if preferred.
The editor reports an error
Copy the newest downloaded file again and replace every line in the source editor. Do not paste the TradingView release package here. If an error remains, send support its exact text and your release ID.