DAILY LEVELS FOR FUTURES & STOCKS

Know your levels before the opening bell.

Every trading morning, DarkLevels publishes support and resistance zones for ES, NQ and a 50+ stock watchlist, ready to paste onto your TradingView or thinkorswim chart.

Free plan: ES, NQ, SPY and QQQ. No card needed.

Zone flip · illustration
RESISTANCE SUPPORT
The indicator colors each zone against the latest price: above price is resistance, below is support. When price breaks through, the zone flips with it.
  • ES
  • NQ
  • SPY
  • QQQ
  • NVDA
  • TSLA
  • META
  • AMD
  • TSM
  • MSFT
  • GOOGL
  • AMZN
  • AVGO
  • PLTR
  • COIN
  • MSTR
  • HOOD
  • MU
  • SMCI
  • ORCL
  • CRM
  • SHOP
  • UBER
  • PANW
  • SNOW
  • CL
  • SMH
50+instruments on the watchlist
Before the openzones published each trading day
2 platformsTradingView & thinkorswim
FreeES, NQ, SPY & QQQ to start
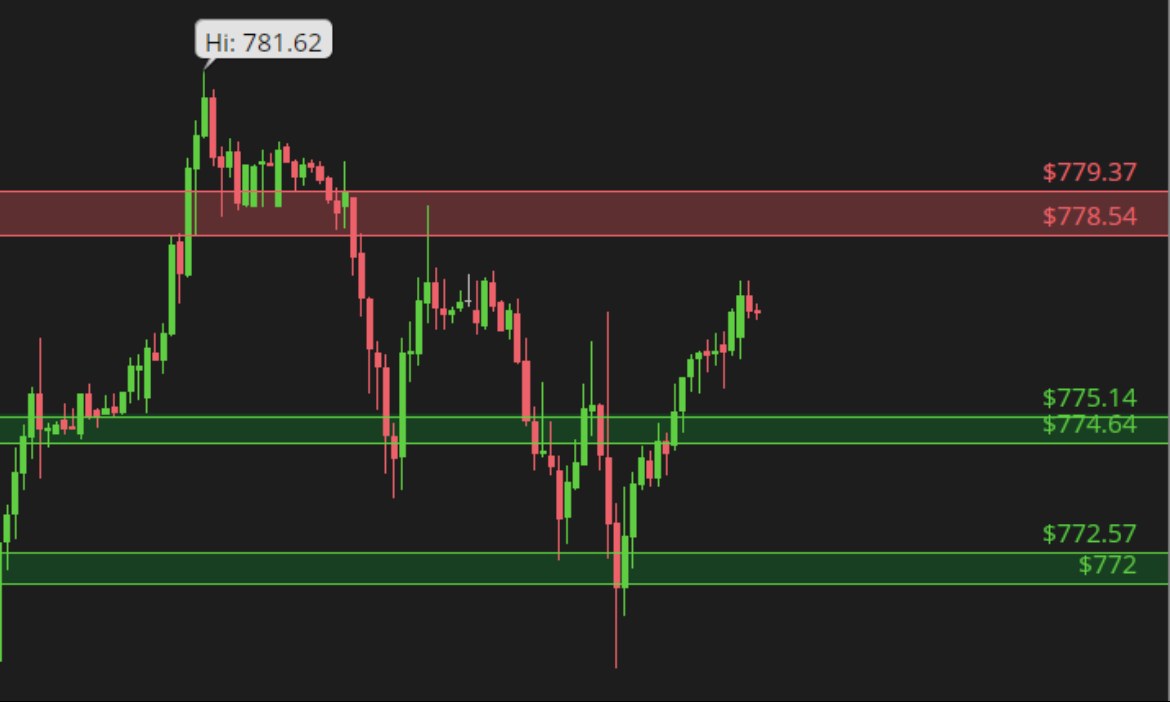
ON A REAL CHART

Zones, not guesswork

Each zone is a price range with a clear top and bottom, so you can see exactly where price stalled, bounced or broke through.

  • Resistance: a zone above the current price
  • Support: a zone below the current price
Candlestick chart with a red resistance zone above price and two green support zones below it, each labeled with its price range Resistance · 778.54–779.37Support · 774.64–775.14Support · 772.00–772.57
WHAT YOU GET

Everything you need to prepare, in one place

Morning zones

Supply and demand zones for index futures and active stocks, published before the open and valid for that session.
Daily brief & analysis

Market context and bull/bear scenarios, so you know why a zone matters.

Level board

How far every instrument sits from its nearest zones, measured in ATR.

Economic & earnings calendar

See the market-moving events before you plan a trade around a zone.

Community & live sessions

Discord for every plan. Elite members join live sessions on market days.

Previews use sample data for illustration.
HOW IT WORKS

From release to chart in under a minute

  1. 1Copy today’s releaseA new release is published each trading morning. One click copies it.
  2. 2Paste it into the indicatorOne field in TradingView or thinkorswim. No drawing, no typing prices.
  3. 3Your zones appearEvery zone draws itself, red above price and green below, and flips as price moves.
Works withTradingViewthinkorswimSetup: TradingView guide · thinkorswim guide · video
DarkLevels emblem with glowing red and green zone bars

Start free. Upgrade when you want the full watchlist.

  • Free ES, NQ, SPY and QQQ analysis, the economic calendar and the free Discord.
  • Premium · $29.99/mo The 50+ instrument watchlist plus TradingView and thinkorswim indicators.
  • Elite · $149.99/mo Everything in Premium plus live trading sessions on market days.